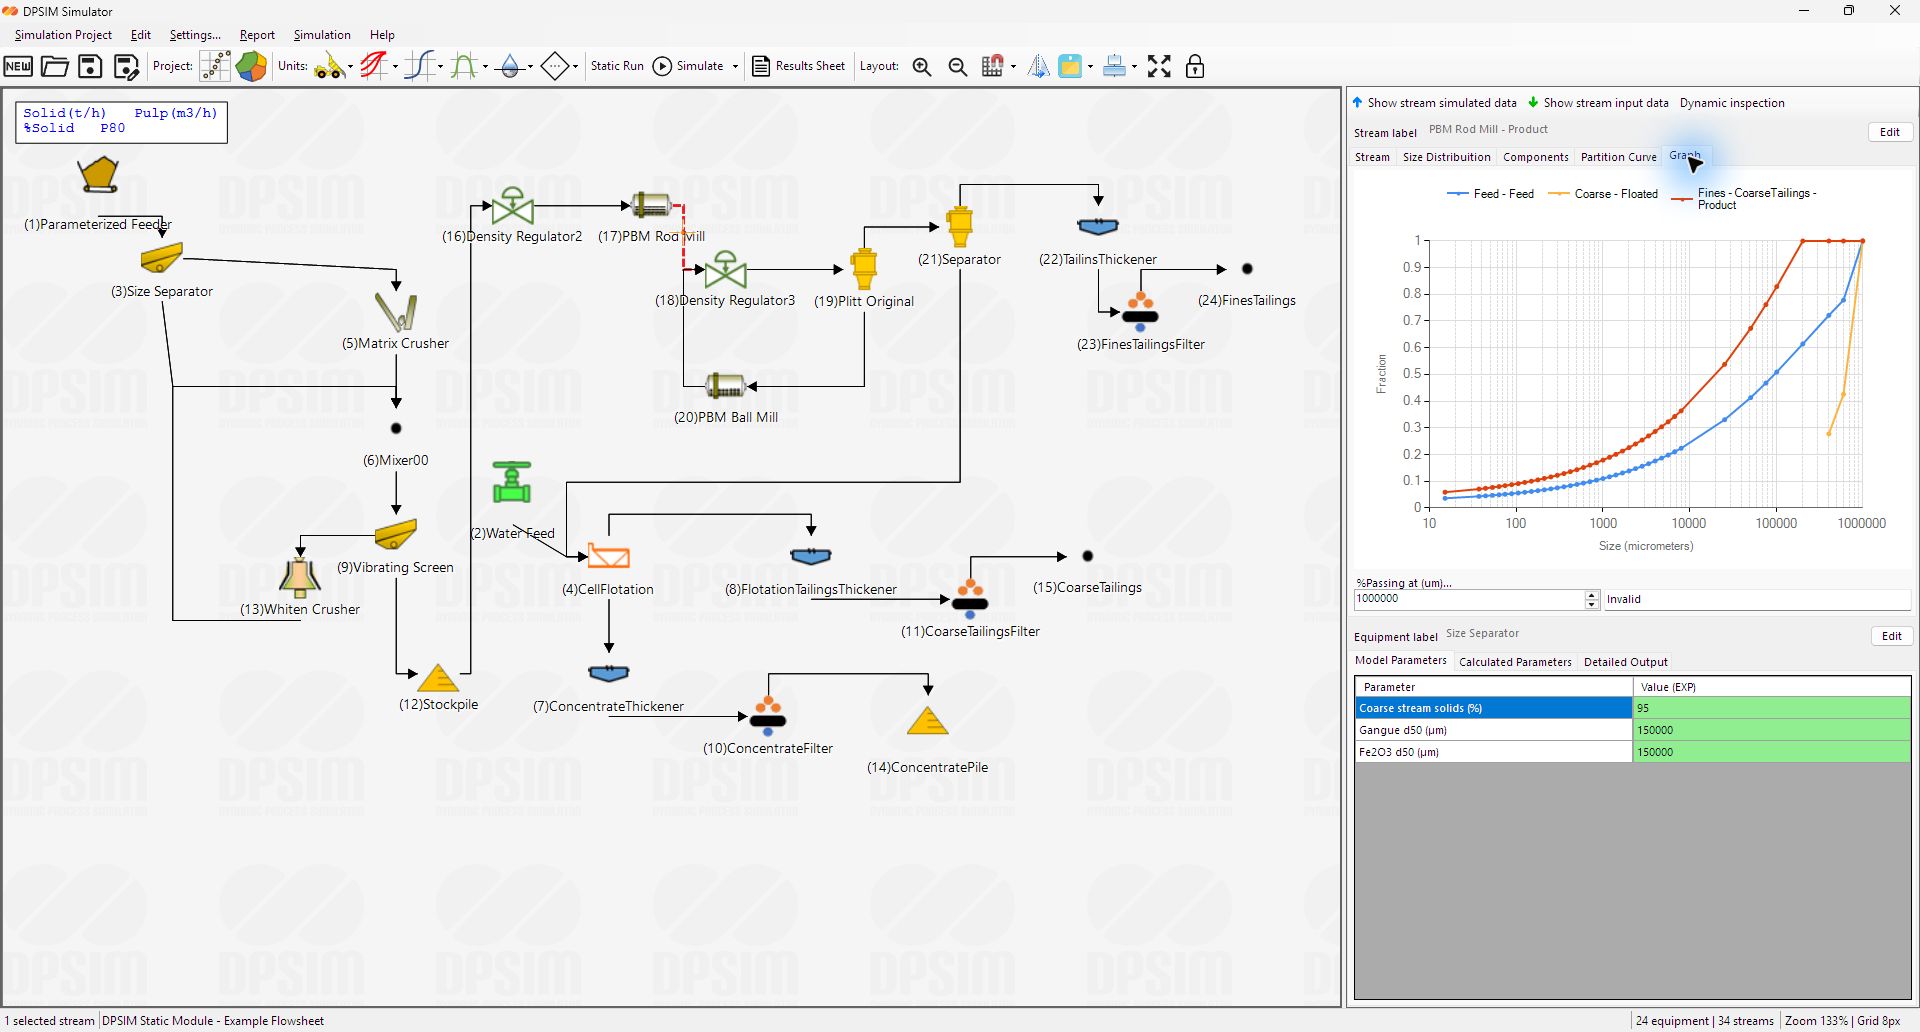
Running a simulation produces calculated material streams throughout the flowsheet.
The next step is to inspect those streams and understand what the process models have calculated.
The Stream Results Sheet provides a configurable table where multiple streams can be compared using quantities such as flowrates, percent solids, densities, component grades and particle size characteristics.
In this tutorial, we will use the Results Sheet to examine the first simulation built throughout this series.
In this tutorial you will learn how to:
- open the Stream Results Sheet;
- understand the default results;
- select which streams are displayed;
- select which results are displayed;
- compare streams across the flowsheet;
- switch between streams as columns or rows;
- distinguish Refresh from Run Static + Load;
- add additional calculated results;
- perform basic engineering checks using the results table.
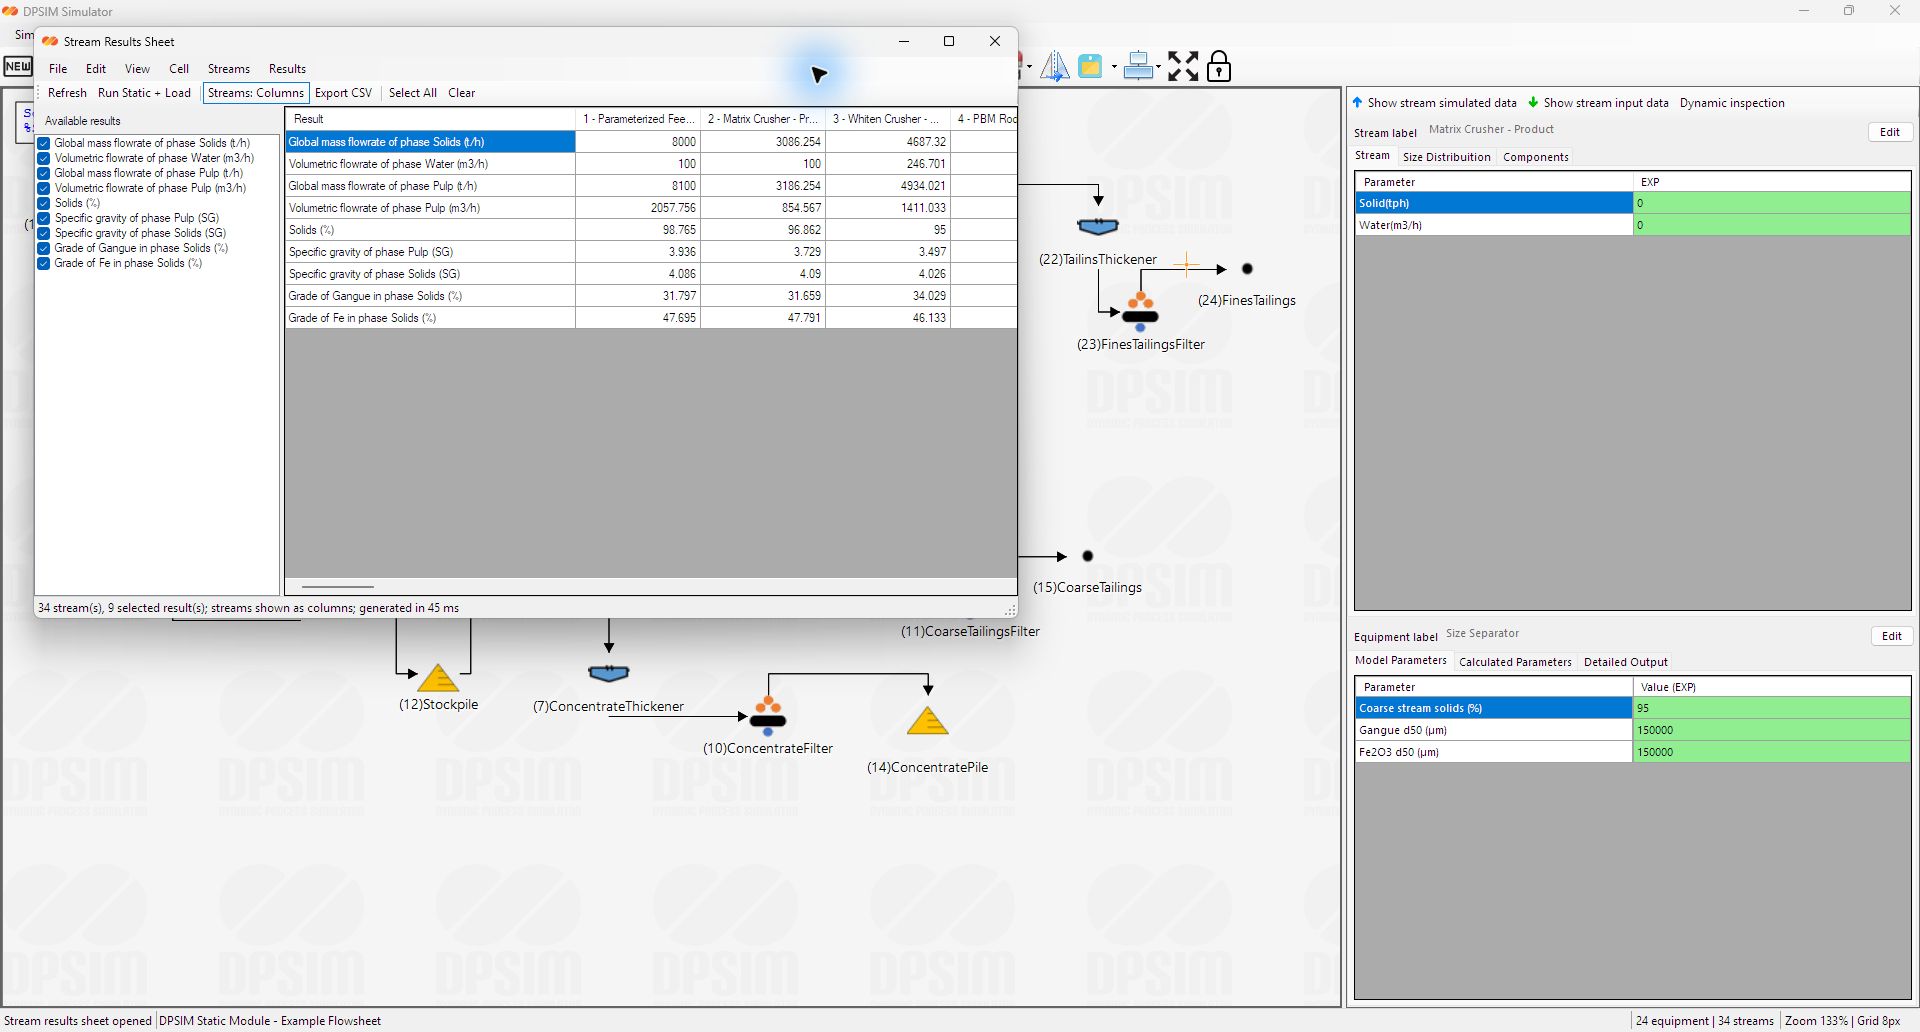
Opening the Results Sheet
After running the static simulation, select:
Results Sheet
from the DPSIM toolbar.
The Stream Results Sheet window opens.
The window contains two main areas.
On the left:
Available results
On the right:
Results table
The Available Results list controls which properties appear in the table.
The table displays those properties for the selected process streams.
This allows the same Results Sheet to be configured differently depending on what you are trying to analyze.
Understanding the default results
When the Results Sheet is first opened, DPSIM provides a set of standard stream properties.
These include:
Global mass flowrate of phase Solids (t/h)
Volumetric flowrate of phase Water (m³/h)
Global mass flowrate of phase Pulp (t/h)
Volumetric flowrate of phase Pulp (m³/h)
Solids (%)
Specific gravity of phase Pulp
Specific gravity of phase Solids
and the overall grade of each component defined in the project.
For our example containing:
Hematite
and:
Quartz
the Results Sheet can therefore display the calculated grade of each component for every selected stream.
This provides a compact material balance view of the circuit.
Streams as columns
By default, DPSIM can display the streams as columns.
The table then has the form:
| Result | Stream 1 | Stream 2 | Stream 3 |
|---|---|---|---|
| Solids | … | … | … |
| Water | … | … | … |
| Solids (%) | … | … | … |
| Solid SG | … | … | … |
| Hematite grade | … | … | … |
| Quartz grade | … | … | … |
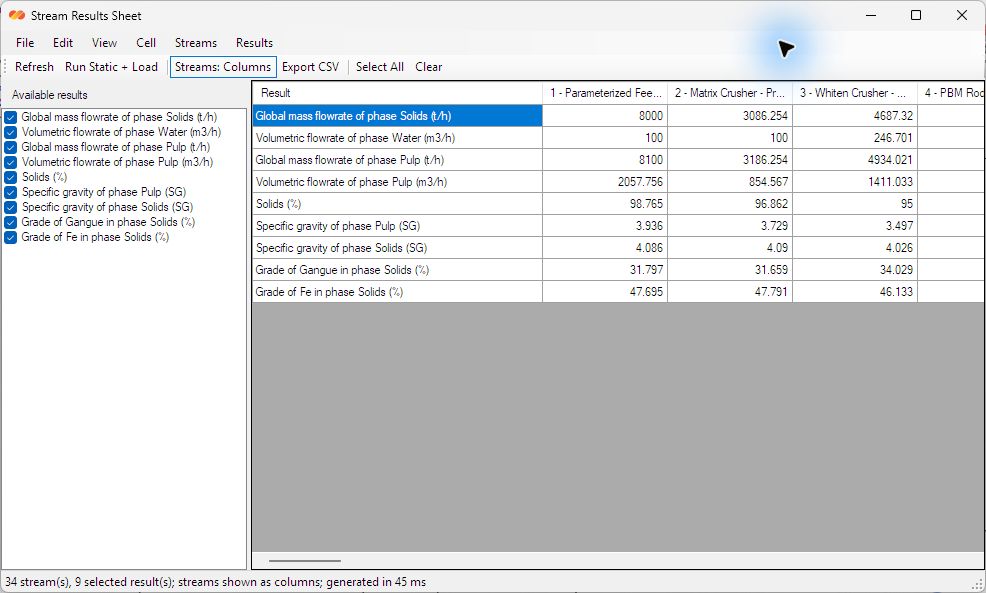
This orientation is particularly useful when comparing several properties across a relatively small number of streams.
For example:
Crusher Feed
Crusher Product
Screen Oversize
Screen Undersize
can be placed beside each other.
The changes produced by each process unit then become easy to identify.
Stream numbers and labels
Each stream in DPSIM has a flowsheet stream number.
If stream labels are enabled, the Results Sheet can display both:
stream number
and:
stream label
For example:
3 – Crusher Product
Meaningful stream labels make larger result tables much easier to interpret.
Instead of trying to remember what:
Stream 8
represents, the table can identify it as:
8 – Cyclone Overflow
This becomes increasingly important as the flowsheet grows.
Selecting the streams to display
You do not need to display every stream in the flowsheet.
Open:
Streams → Add Stream…
and enter the desired stream number.
This allows you to create a focused comparison.
For example, when analyzing a screen you may only need:
Screen Feed
Screen Oversize
Screen Undersize
Streams that are not relevant to the current analysis can be removed from the Results Sheet without removing them from the flowsheet itself.
This only changes the report configuration.
It does not change the simulation.
Comparing a unit operation
A useful way to analyze any equipment model is to compare its feed and products directly.
For a screen:
Feed
Oversize
Undersize
Start with the solids flowrates.
Conceptually:
Feed solids ≈ Oversize solids + Undersize solids
For example:
1,000 t/h ≈ 620 t/h + 380 t/h
This provides an immediate mass balance check.
Then compare other properties.
The Oversize should generally become coarser.
The Undersize should generally become finer.
If composition varies with size, their component grades may also differ.
The Results Sheet therefore allows both the process transformation and its balance to be inspected in the same table.
Selecting which results are displayed
The list on the left side of the Results Sheet contains the available results.
Check a result to display it.
Uncheck it to remove it from the table.
For example, a basic mass balance review might include only:
Solids flowrate
Water flowrate
Solids (%)
Hematite grade
Quartz grade
A slurry handling analysis may instead emphasize:
Pulp volumetric flowrate
Solids (%)
Pulp SG
A result does not need to be relevant to every engineering question.
Configure the table for the analysis being performed.
Select All and Clear
The toolbar provides:
Select All
and:
Clear
Select All activates all available results.
This can be useful when exploring what information is available.
Clear removes the selected results from the table, allowing a new report configuration to be built from scratch.
For most engineering comparisons, a smaller set of relevant results is easier to interpret than displaying every available quantity at once.
Streams can also be displayed as rows
The table orientation can be changed using:
Streams as Columns
or:
Streams as Rows
The transpose button provides a quick way to switch between the two.
With streams as rows, the table becomes:
| Stream | Solids | Water | Solids % | Grade |
|---|---|---|---|---|
| Feed | … | … | … | … |
| Product A | … | … | … | … |
| Product B | … | … | … | … |
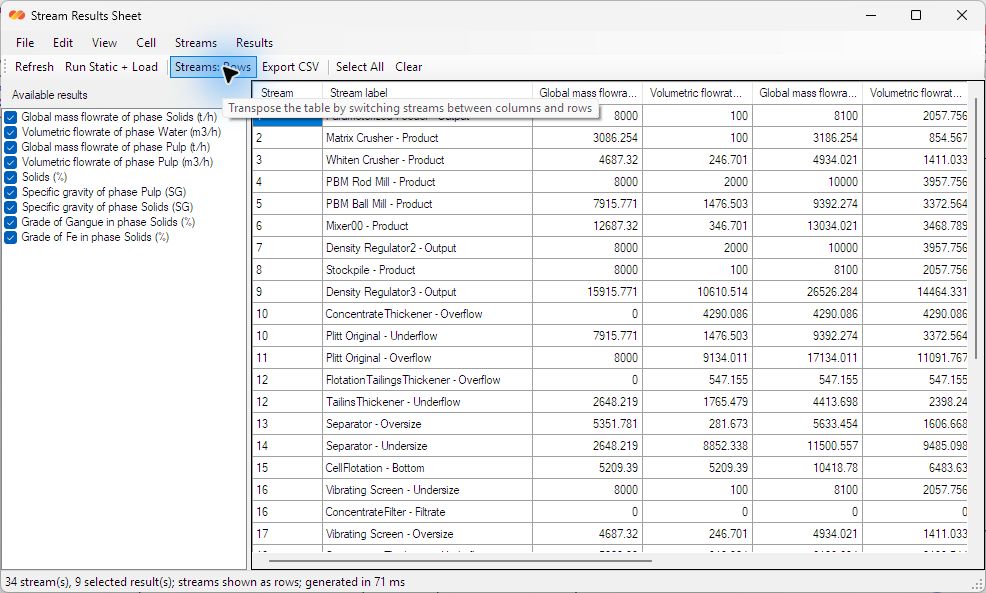
This orientation can be more convenient when:
- many streams are being compared;
- only a few results are required;
- the table will be transferred into another engineering document.
Both orientations contain the same simulation information.
Only the presentation changes.
Refresh does not run the simulation
The Results Sheet contains a:
Refresh
button.
Refresh rebuilds the table using the stream values currently stored in the project.
It does not run the static simulation again.
This distinction is important.
If only the table configuration has changed, for example by adding another result, use:
Refresh
If a feed condition or equipment parameter has changed, the process itself must be recalculated.
In that case, use:
Run Static + Load
Run Static + Load
The Results Sheet also provides:
Run Static + Load
This command performs the static simulation and then reloads the results table.
The workflow becomes:
Change parameter
↓
Run Static + Load
↓
Compare new results
This is particularly convenient when evaluating alternative operating conditions because the Results Sheet can remain open while the process model is being modified.
Understanding solids flowrate
The solids result represents the dry solid mass flowrate of the stream.
For example:
1,000 t/h
This is normally one of the first quantities to inspect.
For equipment that does not generate or consume solid material, the solids balance should close.
For a two-product separator:
Feed solids ≈ Product A solids + Product B solids
For a mixer:
Output solids ≈ Sum of input solids
These simple checks can quickly reveal incorrect stream connections or unexpected model behavior.
Understanding water flow
DPSIM also reports the water flow associated with each stream.
In the default Results Sheet, water is shown as a volumetric flowrate.
Water becomes especially important in:
- grinding circuits;
- hydrocyclones;
- flotation;
- thickening;
- filtration;
- density control.
A process unit may conserve total water while redistributing it between different products.
For example, a hydrocyclone sends part of the water to the underflow and the remainder to the overflow.
Comparing the water flows helps explain the resulting percent solids in each product.
Understanding percent solids
The:
Solids (%)
result describes the solids concentration of the pulp on a mass basis.
Conceptually:
Solids % = Solids mass / Total pulp mass × 100
A stream containing:
100 t/h solids
and:
100 t/h water
contains:
50% solids by mass
Percent solids is particularly useful when checking slurry circuits.
A material balance may have the correct dry solids flow while still producing an unrealistic slurry concentration if the water balance is incorrect.
Solids specific gravity
The:
Specific gravity of phase Solids
is calculated from the component composition and the densities defined earlier in the project.
This means that two streams can have different solid specific gravities if their compositions are different.
For example, if a separator produces:
a hematite-rich product
and:
a quartz-rich product
the hematite-rich stream may have a higher calculated solid SG.
This is a direct consequence of the component-based material representation introduced earlier in this series.
Pulp specific gravity
The:
Specific gravity of phase Pulp
depends on both:
solid density
and:
solids concentration
Two streams containing the same mineral composition can therefore have different pulp SG values if their percent solids differs.
This makes pulp SG useful when reviewing:
- slurry transport conditions;
- classification circuits;
- density control;
- thickener products.
As always, the calculated value should be checked against physically reasonable operating ranges for the process being studied.
Component grades
For every component defined in the project, DPSIM can display its overall stream grade.
For example:
Grade of Hematite in phase Solids
Grade of Quartz in phase Solids
Suppose the screen feed contains:
75% Hematite
while the undersize contains:
82% Hematite
This does not necessarily mean that the screen explicitly separates hematite.
If hematite is preferentially concentrated in the fine size fractions of the feed, a size separation alone can change the overall grade.
This is the consequence of the component-by-size representation defined earlier.
Grade and mass flowrate should be considered together
A higher product grade does not necessarily mean a higher recovery.
For example:
Feed
1,000 t/h solids
70% valuable component
contains:
700 t/h valuable component
Suppose a concentrate contains:
300 t/h solids
90% valuable component
The valuable component flow is:
270 t/h
The product grade is high, but only part of the valuable material reports to that product.
This distinction between:
grade
and:
recovery
is fundamental in mineral processing.
The Results Sheet can be configured to evaluate both.
Adding a new result
The Results Sheet is not limited to the default properties.
Select:
Results → Add Result…
The Column Description window allows a new calculated result to be configured.
Available data types include quantities such as:
- Mass Flowrate;
- Volumetric Flowrate;
- Size Fraction;
- Component Grade;
- dX;
- %-Passing or %-Retained;
- Percent Solids;
- Specific Gravity;
- Recovery.
This makes the Results Sheet more than a fixed report.
It can be configured around the engineering question being studied.
Adding P80
Particle size is commonly summarized using:
P80
the size at which 80% of the material passes.
In the Results Sheet, this can be created using the dX result type.
Select:
Results → Add Result…
Then configure:
Data type: Size Distribution DX
Phase: Solids
Passing percent X: 80
Unit: µm or mm
The result is:
d80 of phase Solids
which corresponds to the stream P80.
The same tool can be used to calculate:
d50
d90
d95
or another passing size.
We will explore particle size results in more detail in the next tutorial.
Adding percent passing at a selected size
Another useful result is the cumulative percentage passing a selected size.
For example:
%-passing 1 mm
This allows several streams to be compared at a specific process criterion.
Examples include:
%-passing 150 µm
%-passing 75 µm
%-retained 1 mm
Such values can be especially useful when the design requirement is expressed as a product specification rather than only as P80.
Adding recovery
The Results Sheet can also calculate recovery relative to a selected reference stream.
For example, select:
reference stream = plant feed
and:
component = Hematite
The resulting value represents the recovery of that component in each displayed stream relative to the selected reference.
Conceptually:
Recovery = Component flow in product / Component flow in reference stream × 100
This can be useful when evaluating concentration circuits.
Recovery calculations should always use a clearly defined reference stream.
Comparing the crusher feed and product
Return to our tutorial flowsheet:
Editable Feed → Crusher → Screen
First compare:
Crusher Feed
and:
Crusher Product
For an ideal size-reduction operation, the dry solids flowrate should remain essentially unchanged.
The component grades should also remain unchanged unless the selected model includes some form of component-dependent behavior.
The main transformation should appear in the particle size results.
For example:
Feed P80 = 700 µm
Product P80 = 300 µm
This provides a simple check that the crusher model is operating in the expected direction.
Comparing the screen products
Now compare:
Screen Feed
Oversize
Undersize
Check:
Mass balance
Feed solids versus the sum of both products.
Water balance
Feed water versus the water distributed to both products.
Particle size
Oversize should be coarser than Undersize.
Grades
If component composition varies with size, product grades may change.
This is already enough to perform a meaningful first review of the screen calculation.
Configure the table for the engineering question
There is no single ideal Results Sheet configuration.
For a crusher, you might use:
Solids flowrate
P80
%-passing selected size
For a flotation circuit:
Solids flowrate
Component grade
Component recovery
For a hydrocyclone:
Solids flowrate
Water flowrate
Solids %
P80
For a thickener:
Solids flowrate
Water flowrate
Solids %
Pulp SG
The Results Sheet should contain the information needed to answer the engineering question, not simply every quantity available in the simulator.
Results are calculations, not validation
A value appearing in the Results Sheet means that DPSIM calculated it from the model.
It does not automatically mean that the value accurately represents a real plant.
The engineering workflow remains:
Input data
↓
Model
↓
Calculated results
↓
Engineering verification
Results should be compared with:
- mass balance expectations;
- physical constraints;
- plant measurements;
- laboratory data;
- equipment specifications;
- expected process behavior.
The Results Sheet makes those comparisons easier, but it does not replace them.
From summary results to particle size behavior
The Results Sheet provides an efficient overview of the main stream properties.
But mineral processing performance often depends on what is happening inside the particle size distribution, not only on a single value such as P80.
Two streams can have the same P80 while having different distribution shapes.
Likewise, two streams can have the same overall grade while the valuable component is distributed very differently across particle sizes.
The next tutorial will therefore go deeper into:
particle size distributions
fraction retained
cumulative passing
and:
component-by-size results
to understand how DPSIM represents the complete particle population.