
DPSIM Player · Reference
Player reference manual
A detailed reference for workspaces, controls, data behavior and common problems. Use the tutorials for a checked step-by-step exercise.
Recorded data and presentation
Player opens a .dpsplay recording and replays its saved states. It does not execute equipment models or scripts, interpolate unrecorded process states or edit numerical simulation results. Layout, chart configuration, the selected analysis interval and chart library are presentation data saved with the local recording.
Interface reference by task

| Task | Control / panel | Read alongside it |
|---|---|---|
| Choose the result | Open local or Online → Open online | Run details and the study identity. |
| Find the item | Route selection, equipment/stream selector, Find variable | Owner, port, unit and SIM/EXP provenance. |
| Inspect an instant | Playback controls and Recorded time | State index and original recording interval. |
| Choose data for analysis | Analysis range start/end or blue handles | Inclusive endpoints and displayed time unit. |
| Navigate the timeline | Show all, Fit selection, Playhead, zoom and pan | Visible window; separate from data selection. |
| Compare variables | Recorded trend → Add series | Units and left/right axes. |
| Calculate distribution statistics | Analysis → Generate histogram | Included/missing/out-of-range counts. |
| Keep a review | Add to library, Chart library / Chart studio, Save local | Current local filename and save success message. |
Open and save commands
| Command | Behavior |
|---|---|
| Open local / Ctrl+O | Open a local recording. |
| Online → Open online | Retrieve an available online result, validate and save it locally, then open it. |
| Save local / Ctrl+S | Write layout, selected interval and chart library into the current local recording. |
| Save local as / Ctrl+Shift+S | Make a complete local recording copy with the current presentation. |
| Load layout | Import a separate .dpslayout presentation file; it is not a process recording. |
| Chart library | Keep and revisit configured plots; save the recording to retain changes. |
Save online is not exposed in the current desktop workflow. Online result storage is temporary delivery. Keep a local recording for later review and distribution. If a save fails, pending changes remain open so you can correct the problem.
Playback, time and intervals
| Control / marker | Meaning |
|---|---|
| Play / pause, previous / next, speed, Loop | Navigate recorded states; speed changes playback, not simulation settings. |
| Recorded time | Time of the state actually loaded into the inspector. Seeking chooses the state at or before the requested time. |
| Green / grey timeline markers | Recorded states / calculation cycles without saved values. Dense markers may be reduced at wide zoom. |
| Analysis range and blue handles | Interval used by recorded trends, histograms and CSV analysis. |
| Show all / Fit selection / Playhead | Navigate the visible timeline window. This is separate from choosing a state or analysis interval. |
| Time unit | Change the displayed time unit, not the recording cadence. |
Timeline wheel zooms; Shift+drag or middle-button drag pans. A time interval does not imply data exists at every instant in it. Changes between recorded cycles may be missed.
Route and inspector
Fit, zoom and Layout organize the view. Show analysis panel and Reset panel sizes restore a useful split. Select equipment or a stream to inspect its available recorded variables; search and the item selector help locate data.
SIM identifies simulation output; EXP identifies experimental/input data where supplied. A file can contain no EXP data. Size distribution and component views use the current recorded state. Aperture display can switch between µm and mm. Values remain read-only. Events and warnings and Run details provide recorded context, where present.
Trends and chart library
Double-click a variable, drag it to the recorded trend or use Add series. Series controls let you edit, hide, remove and choose the left or right Y axis. Keep labels and units explicit, especially when mixing quantities or SIM and EXP. The playhead cursor relates the time-series chart to the selected process state.
Chart configuration changes appearance. Add to library stores a configured plot in the current workspace; Chart library retrieves it. Save local retains the library in the recording. Export chart image produces a report figure. The chart may reduce points for display; this does not create or delete recorded samples.
Histograms, statistics and CSV
Analysis / Histogram–CSV provides a series selector, optional EXP inclusion and an inclusive From/To interval. Histogram settings include bin count, automatic or specified value range, Count/Percent/Density and cumulative distribution. Generate histogram reads the recorded data in that interval.
The summary reports included, missing/non-numeric and out-of-range sample counts, the included-sample mean and sample standard deviation. Frequencies count samples, not elapsed duration. Review exclusions before interpreting a statistic; it is not automatically a time-weighted process average.
Export series CSV uses all recorded rows in the selected time range, including missing values, rather than only chart display points. Select the separator and decimal-comma convention before export. A CSV or chart image does not retain the complete recording or editable project.
Optional script source
Scripts is enabled only when source was included by Developer before execution. The source viewer is read-only and permits reading and copying. It includes script metadata and can include disabled scripts. Player does not execute the code.
Omitted source cannot be recovered by Player. To provide a recording without source, generate it with source inclusion disabled in Developer; the documented Player workflow does not offer removal of included source. This choice does not conceal the recording’s remaining process data.
Local sharing and unsaved work
Use Save local as to keep a reviewed copy, reopen it to check the presentation, then send that file through an appropriate transfer method. Recipients need Player and access to the file. Include the study identity, relevant interval and Player version used. A managed or revocable sharing link is not part of this desktop save workflow.
On open/close with pending presentation changes, Save local retains them, Discard abandons them and Cancel returns to the workspace. This is an unsaved-work guard, not file encryption or access control. Keep your original recording when you need a baseline.
Troubleshooting
| Symptom | Check |
|---|---|
| Recording fails to open | File format, complete transfer and compatible Player version; retain the original. |
| Inspector is missing | Layout → Show analysis panel, then Reset panel sizes. |
| No EXP comparison | Whether the producing recording includes EXP data; SIM is shown by default. |
| No script source | Whether Developer included source before sending; Player cannot reconstruct it. |
| Event absent at high zoom | Recording interval, recorded markers and actual recorded time. Zoom does not create samples. |
| Wrong histogram or CSV period | Inclusive From/To and analysis range, not just the visible chart window. |
| Saved chart is missing after reopen | Add it to Chart library and successfully Save local in the intended copy. |
| Online recording no longer available | Use your archived local copy; temporary server delivery is not permanent storage. |
Chart editor and Chart studio are different stages
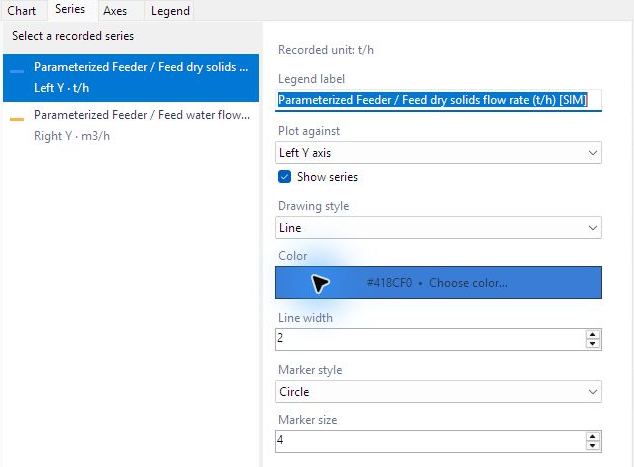
| Stage | Main controls | Persistence |
|---|---|---|
| Displayed chart preview | Chart, Series, Axes and Legend; Apply to chart / Cancel | Apply changes the displayed plot. It does not automatically create a library entry. |
| Add to library | Chart context menu or chart options | Creates an entry in the current workspace. |
| Chart studio | Saved charts list; Chart settings, Series, Time range; Apply chart settings | Edits retained chart definitions in the open workspace. |
| Save in recording / Save local | Writes the workspace into the current local .dpsplay | Required to retain changes after reopening. |
| Export image | Exports a plotted figure | Does not save the complete recording or library. |
Library name is the saved-entry label; Chart title is the displayed title. Axis labels, limits, legend position and notes help make a saved review interpretable. A changed label is not a unit conversion.
Analysis fields and statistical population
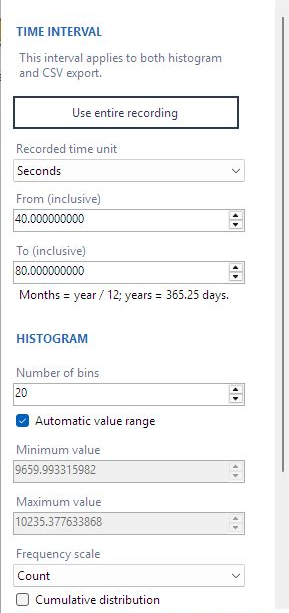
| Field | Behavior / interpretation |
|---|---|
| Scope and Search | Filter selected item, equipment, streams, tags or all recorded series. Check retained selection. |
| Include EXP | Available only when the recording contains the relevant input/experimental data. |
| From / To (inclusive) | Both endpoints are included when recorded samples exist there. |
| Number of bins | Controls histogram grouping, not the recorded data cadence. |
| Automatic / manual value range | Manual limits can exclude finite numeric values; inspect below/above counts. |
| Count / Frequency (%) / Probability density | Different normalization of the same included samples. Frequencies are sample based, not elapsed-time weighting. |
| Cumulative distribution | Accumulates counts or normalized frequency across bins. |
| Mean / sample standard deviation | Describe the included histogram samples. Missing values and range exclusions affect the population. |
| CSV separator / Decimal comma | Control exported text conventions; match them on import. |
| Cancel operation | Stops a running analysis/export operation where enabled; it is not a simulation cancel command. |
Histogram and CSV may use different populations when manual histogram value limits exclude samples: CSV keeps all recorded rows in the chosen time range, including missing values. The chart display may reduce dense points, while analysis/export scans the recorded series.
A checked five-sample reference
The existing practice recording used for these new captures lasts 120 s and saves every 10 s. An inclusive 40–80 s interval produces five samples. Its feeder dry-solids series gives a mean of 9,916.9497074 t/h and sample standard deviation of 241.1289276 t/h, with no missing or out-of-range samples in automatic range. The native CSV export was checked independently and reproduced these statistics.
This reference checks the procedure. It is not a promised output of a fresh random run or evidence that the illustrative model is calibrated. Follow the full analysis exercise for the five rows and delimiter/decimal examples.