
A circuit with two concurrent objectives
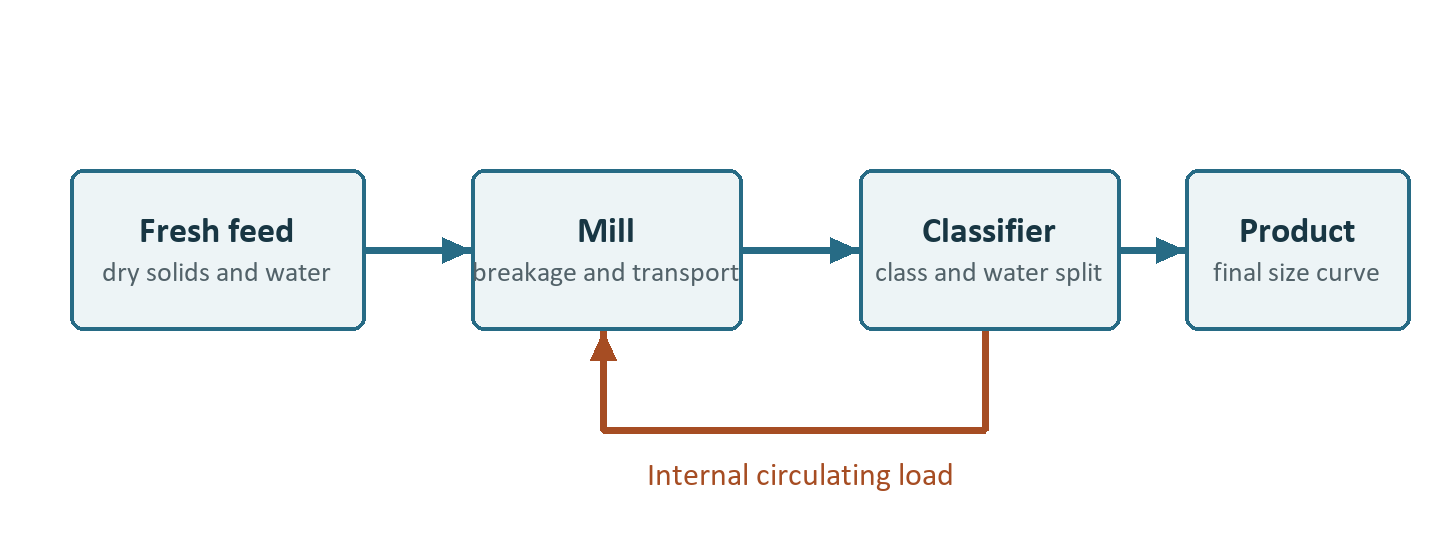
A concentrator needs 100 dry t/h of ground ore with P₈₀ close to 110 µm and a reasonable mill and cyclone duty. The overflow goes to concentration, and the underflow returns to the mill. The decision is whether a finer classifier setting justifies its circulating load and water demand. This chapter begins a common three-chapter design case. The stream data are synthetic and intentionally coarse so every calculation can be audited. No parameter in the example is an equipment design rating.
The size classes, in order from coarsest to finest, are 150–300 µm, 75–150 µm, and below 75 µm. Fresh ore has 40, 35, and 25 dry t/h in these classes. The solids mill feed vector x, discharge vector g, recycle u, and overflow o share this class order. A steady empirical single-pass transfer matrix B maps x to g. Its entry Bᵢⱼ gives mass fraction of mill feed class j reporting to discharge class i. The numbers could be fitted by a richer population-balance model and collapsed for classroom use. Individual columns of a matrix of this kind are not identifiable from one overall mill feed and discharge pair without additional data or structural assumptions. Separate breakage and selection tests constrain more detailed models. Austin and Luckie, 197280022-6)
| Discharge class | Feed 150–300 µm | Feed 75–150 µm | Feed below 75 µm |
|---|---|---|---|
| 150–300 µm | 0.60 | 0 | 0 |
| 75–150 µm | 0.25 | 0.55 | 0 |
| Below 75 µm | 0.15 | 0.45 | 1.00 |
| Column total | 1.00 | 1.00 | 1.00 |
The underflow solids recoveries by class are r = (0.85, 0.45, 0.10). Define D = diag(r). These are actual partitions, inclusive of fine short-circuiting on the measured solids basis. Water recovery to underflow is a separately imposed 0.35. The model holds both this water recovery and r fixed at the base survey condition. A cyclone hydraulic model would generally couple the two through operating conditions. Mass conservation is independent of that level of model detail.
Closing the recycle and reproducing the size result
Conservation and routing give g = Bx, u = Dg and o = (I − D)g. At the mill feed x = f + u. This eliminates all internal streams except x.
Forward substitution works because B has no upward transfer to coarser classes. A mill model with specific breakage rates, holdup and a mixing subdivision would generate additional equations, with the same balance and routing at its external ports. An iterative flowsheet should land on the direct solution for this simple case. The diagonal entries of the linear recycle operator DB are 0.51, 0.2475 and 0.10. As a triangular operator its eigenvalues are those entries, so fixed-point iteration on this independent case is asymptotically convergent. Set a per-class acceptance test because a stable total can conceal redistribution.
| Stream | 150–300 µm | 75–150 µm | Below 75 µm | Total dry t/h |
|---|---|---|---|---|
| Fresh feed | 40.000 | 35.000 | 25.000 | 100.000 |
| Mill feed | 81.633 | 58.716 | 32.074 | 172.423 |
| Mill discharge and classifier feed | 48.980 | 52.702 | 70.741 | 172.423 |
| Cyclone underflow recycle | 41.633 | 23.716 | 7.074 | 72.423 |
| Cyclone overflow product | 7.347 | 28.986 | 63.667 | 100.000 |
The conventional solids circulating load, on fresh dry feed, is 72.42%. The internal-to-fresh solids ratio is 1.724. From the product table, P(75 µm) = 63.667% and P(150 µm) = 92.653%. With cumulative passing assumed locally linear in log size, the interpolated P₈₀ is
Using the identical interpolation convention, fresh feed F₈₀ = 212.13 µm because P(150 µm) = 60% and P(300 µm) = 100%. A P₈₀ above or below a sampled limit requires support from the size analysis. Adding mesh intervals around a controlling size is a way to measure the consequence of the coarse interpolation used here.
Water, power, and alternative operation
Fresh water to the grinding boundary is 100 t/h of water. With water recovery 0.35 to the underflow, mill inlet water W = 100 + 0.35W = 153.846 t/h. Underflow returns 53.846 t/h of water, and overflow carries 100 t/h to concentration. The corresponding dry solids percentages are 52.85% for the mill feed, 57.36% for the underflow, and 50.00% for the overflow. At one illustrative measured mill power of 500 kW, specific energy is 5.00 kWh/t per tonne of fresh ground product and 2.90 kWh/t per tonne of mill-pass solids. Identify which basis a fitted energy model uses. This illustrative electrical measurement does not independently establish mill net grinding power.
A second classifier setting has underflow recoveries of (0.90, 0.55, 0.15). For a controlled mathematical comparison, keep the mill matrix and fresh feed unchanged. Solving again gives 191.337 t/h through the mill, 91.337 t/h recycled, and a product vector (5.217, 26.445, 68.338) t/h. The interpolated P₈₀ decreases to 101.82 µm. Relative to base, an 8.14% reduction in P₈₀ coincides with a 10.97% increase in internal solids flow. If surveyed capacity is 180 dry t/h at the same operating regime, this alternate point is outside the tested capacity. In the constant-coefficient approximation the maximum fresh ore rate is 180/1.91337 = 94.07 dry t/h at unchanged size composition. At that point real cyclone pressure, density, mill residence and actual partitions would need to be verified.
The test treats water split as a separate held input to isolate one effect. A plant trial should record dry rate, cyclone feed solids concentration, sump level, active cyclone count, pressure, and both outlet PSDs and water rates. Reconciled balances on the classifier identify actual and corrected partition curves and demonstrate the range in which a changed split is observed. The fitted mill and classifier must then be tested together at an independent ore condition. A grind-size match alone cannot establish internal mass, water or capacity. A synthetic increase to 50 t/h in the coarsest feed class and decreases to 30 and 20 t/h in the others raises the base-setpoint flow to 183.842 t/h and P₈₀ to 117.50 µm. The example exposes how a constant fresh tonne rate can mask an internal constraint.
Independent engineering checks
For each test, compare fresh dry and water inputs to their corresponding overflow outputs, internal mill throughput to measured capacity on the same basis, component- and size-resolved underflow to reconciled survey results, and energy against metered power and stated mass basis. Report the class-wise residual at the recycle, the assumed water addition points, and whether overflow PSD is generated from an accepted flowsheet solution. For transient changes, the stock in the preceding chapter's sump contributes to the material ledger and delays the effect at the cyclone. An algebraic recycle benchmark does not supply start-up or trip timing.
The downstream chapter receives this case's nominal overflow of 100 dry t/h and 100 t/h water. It imposes valuable mineral mass of 15 t/h and gangue of 85 t/h at this boundary. A more resolved integration would pass the complete size-by-component matrix and use a mineral response for every retained class.
Exercises with answers
- Calculate base cyclone underflow dry solids content by mass. Answer. 72.423/(72.423 + 53.846) = 57.36%.
- The same solids partition is applied with measured water recovery to underflow of 0.40. Find classifier water feed and overflow water. Answer. 100/(1 − 0.40) = 166.667 t/h water enters the classifier. The overflow carries 100 t/h at steady state.
- Suppose the fine product class is entirely returned to the mill and this class is conserved in the mill. Can a finite solution exist when fresh fine feed or breakage production of fines is positive? Answer. No. D₃₃B₃₃ = 1 and the fine balance becomes 0 × x₃ equal to a positive supply. Fine material accumulates until another physical mechanism changes the split or removes it.
- For an internal solids capacity of 180 t/h, what maximum fresh feed does the base matrix predict at fixed composition? Answer. 180/1.72423 = 104.39 dry t/h.